

The EBITDA Interlock: Why Driving Cpk ≥ 1.33 on the Mill Floor Beats Millions in Downstream Testing

Stop paying to detect defects. Start investing in process capability that prevents them.
SECTION 1
Executive Summary
THE BOARDROOM BOTTOM LINE — IN 30 SECONDS
KEY DIMENSION | THE REALITY |
The Business Problem | Plants spend 15–40% of revenue on downstream testing & sorting while Cpk hovers at ~1.04 — inspecting problems that should never occur |
The Root Cause | Quality is treated as a detection activity, not a capability objective. 'Test-and-sort' thinking drives a continuous internal failure loop |
The Financial Impact | World-class plants (Cpk ≥ 1.33) maintain COPQ below 5% of revenue. The gap = pure EBITDA expansion worth tens of millions annually |
The Solution | Shift from reactive downstream sorting to proactive process capability. Institutionalize real-time SPC and lock critical variables upstream |
The Call to Action | Stop funding inspection. Start funding process capability. The Cpk dashboard IS the EBITDA dashboard |
SECTION 2
The Industrial Problem: The Inspection Illusion: "Inspection identifies cost. Capability eliminates cost!"
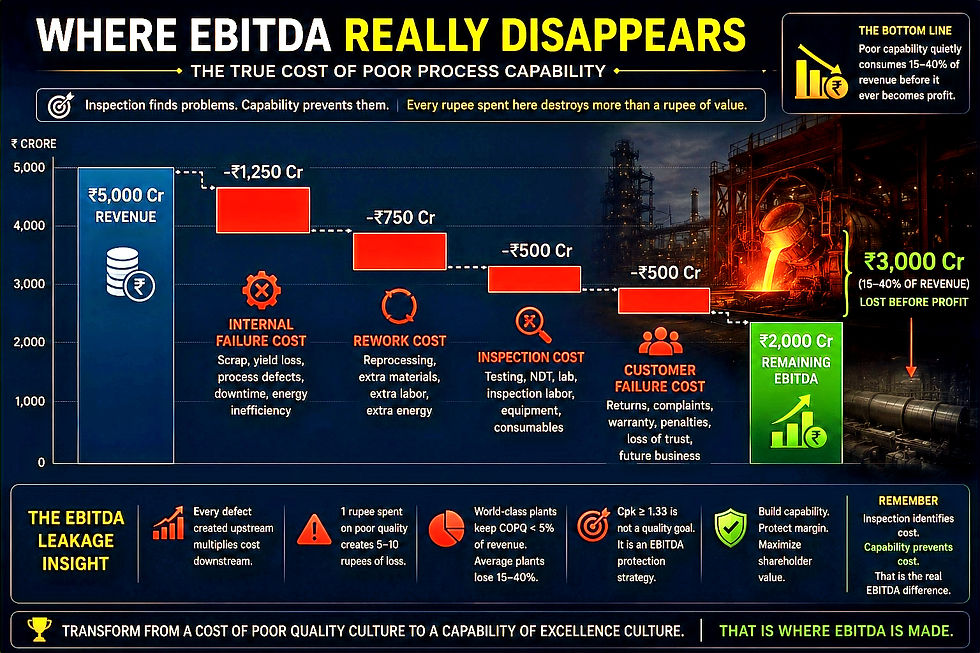
Walk into any conventional steel plant and you will see the same costly ritual repeated across every shift. Incoming raw material testing. In-process inspection checkpoints. Automated Non-Destructive Testing (NDT). Final dimensional and mechanical property verification. Manual sorting of 'suspect' material. Each of these steps costs money. Each consumes labor, energy, and time. Each creates the illusion of quality — the comforting belief that defects will be caught before they reach the customer.
Yet here is the uncomfortable truth that rarely appears in board presentations: Inspection does not prevent cost — it only identifies cost that has already been incurred.
The Hidden Cost of 'Sort-and-Scrap'
Every defect that arrives at downstream inspection has already consumed raw materials now destined for scrap, energy from melting, casting, rolling, and heat treatment, labor from operators, engineers, and inspectors, time that has delayed delivery schedules, and capacity that could have been used for value-adding production. The financial consequence is staggering and largely invisible on most P&L presentations.
PLANT QUALITY LEVEL | Cpk PERFORMANCE | COPQ AS % OF REVENUE | ANNUAL LOSS (₹5,000 Cr Plant) |
World-Class Steel Plants | Cpk ≥ 1.33 | < 5% | ₹250 Cr |
Average Steel Plants | Cpk ≈ 1.04 | 15–40% | ₹750–2,000 Cr |
Below-Average Plants | Cpk < 1.00 | 30–50%+ | ₹1,500–2,500 Cr+ |
THE INSPECTION PARADOX |
For a mid-sized steel plant with ₹5,000 crore in annual revenue, the gap between Cpk 1.04 and Cpk 1.33 represents ₹500–1,750 crore in avoidable costs — every single year. This is not a quality problem. This is a profitability crisis hiding behind inspection reports. |
Who Bears the Cost?
● CEOs and Boards face the paradox: 'We spent millions on inspection, yet defects still reach customers'
● CFOs struggle to explain why quality costs are rising while EBITDA margins compress
● Plant Heads inherit a system where inspection labor grows but first-pass yield stagnates
● Quality Directors are measured by defects caught, not defects prevented — perverse incentive by design
● Customers bear the cost through higher prices, delayed deliveries, and field failures
● Investors watch EBITDA erode while competitors with better process capability capture market share
SECTION 3
Technical Root Cause: What Cpk Actually Tells You

The Definition That Changes Everything
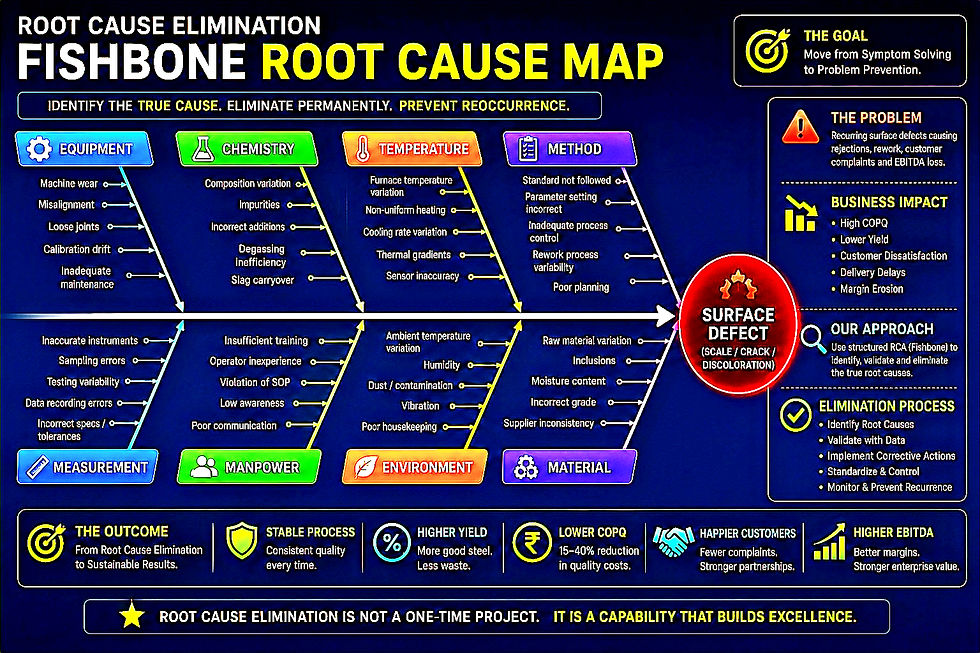
Cpk — Process Capability Index — is the universal metric that answers a single, critical question: 'How well can our process consistently produce output within specification limits?' It measures two things simultaneously: centering (is the process mean positioned between the specification limits?) and spread (how much natural variation exists relative to the tolerance band?).
THE Cpk FORMULA — PLAIN AND POWERFUL |
Cpk = minimum of [ (USL − μ) / 3σ ] and [ (μ − LSL) / 3σ ] |
Where: USL = Upper Specification Limit | LSL = Lower Specification Limit | μ = Process Mean | σ = Standard Deviation |
Why Cpk ≥ 1.33 Is the Industry Gold Standard
Cpk VALUE | SIGMA LEVEL | DEFECTS (PPM) | TOLERANCE USED | OPERATIONAL REALITY |
< 1.00 | < 3σ | > 2,700 | > 100% | Process is inherently incapable — chronic scrap/rework |
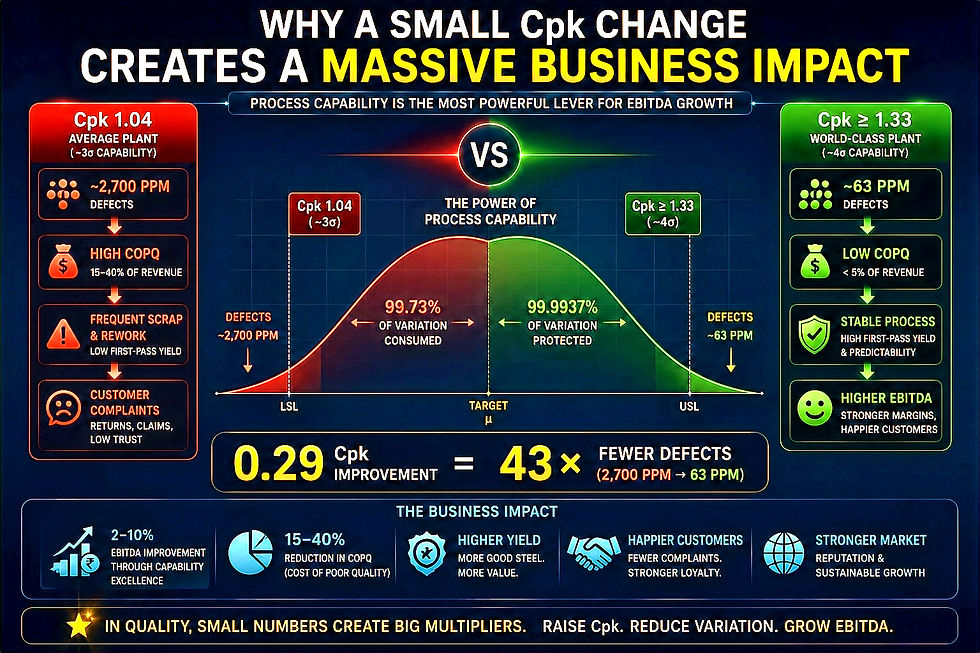
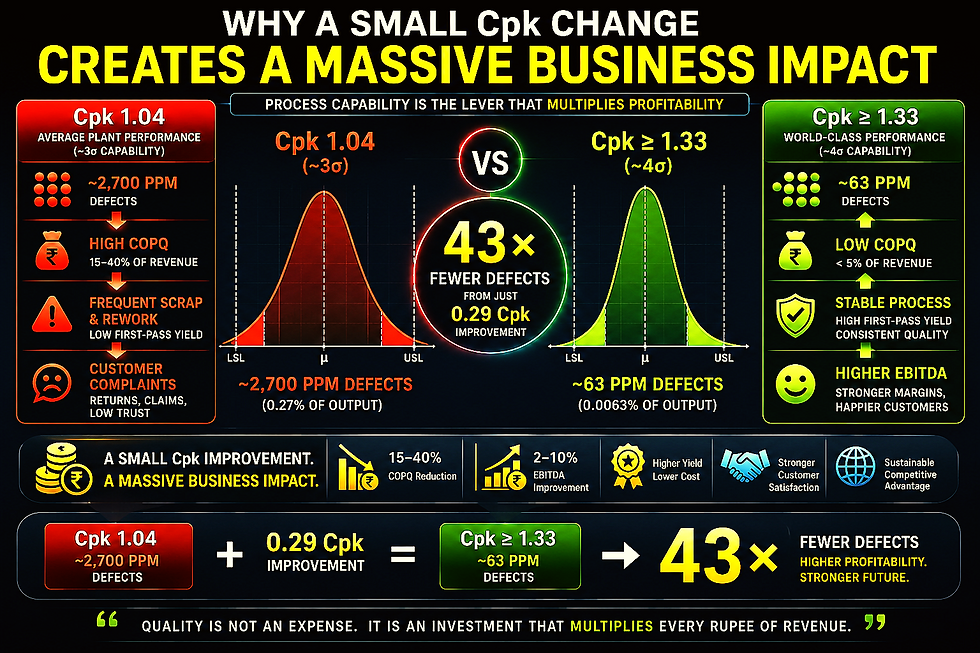
1.04 (Average) | ~3σ | ~2,700 | ~96% | Operating on a knife's edge — any variation causes failure |
1.33 (Target) | 4σ | ~63 | 75% | Robust capability — 25% safety buffer against variation |
1.67 (World-Class) | 5σ | ~0.6 | 60% | Near-zero defect production — maximum EBITDA protection |
The 0.29-point gap between Cpk 1.04 and Cpk 1.33 corresponds to 43 times more defects. At Cpk = 1.04, the process consumes more than 96% of the specification tolerance, leaving virtually no margin for the inevitable variation of real-world steelmaking. Any minor disturbance — a ±15°C temperature gradient in a continuous casting mold, a slight shift in ladle desulfurization timing, localized roll profile wear — pushes the distribution tail past the specification limits.
The Metallurgical Dimension of Cpk
For metallurgists and engineers, Cpk is not an abstraction. Every critical process parameter in steel manufacturing has a Cpk value — and every Cpk value below 1.33 is a source of financial leakage:
PROCESS PARAMETER | METALLURGICAL IMPACT OF LOW Cpk | DOWNSTREAM CONSEQUENCE |
Chemistry (C, Mn, Si, Cr) | Uncontrolled hardenability, weldability, transformation temperature shifts | Hardness failures, mechanical property scatter, customer rejects |
Furnace Temperature Profile | Inconsistent grain growth, austenite conditioning variation, decarburization | Microstructural non-uniformity, surface defects, heat treat failures |
Continuous Casting Parameters | Centerline segregation, macro-inclusions, internal porosity, surface cracks | Rejections in rolling, downstream fracture, quality escapes |
Rolling Temperature & Load | Dimensional instability, dimensional tolerance exceedances, flatness variation | Rework loops, downstream processing failures, customer complaints |
Cooling Rate Control | Inconsistent phase transformation, mechanical property variation lot-to-lot | Strength/toughness scatter, warranty claims, field failures |
Heat Treatment Cycle | Non-uniform hardness, residual stress, microstructure heterogeneity | Field failures in service, warranty exposure, supply chain risk |
For the Non-Metallurgist: The Garage Analogy
TECHNICAL EXPLANATION: |
Cpk quantifies how closely a production process stays to its nominal target (μ) and how tightly clustered its structural variation is (σ) relative to product design limits. |
PLAIN-LANGUAGE INTERPRETATION: |
Imagine parking an industrial transport vehicle inside a narrow garage. If your vehicle is almost as wide as the garage door opening (Cpk ≈ 1.04), the slightest steering deviation or gust of wind causes a collision. If the vehicle is narrower relative to the opening (Cpk ≥ 1.33), you park safely every time — even with minor steering errors. |
BUSINESS IMPLICATION: |
Operating with low Cpk means your equipment is inherently incapable of running without errors. Relying on downstream testing to catch these mistakes means you are paying to manufacture scrap material, then paying a second time to sort it — significantly decreasing your operational EBITDA. |
SECTION 4
Strategic Intervention: From 'Test-to-Sort' to 'Build-to-Spec'
Every defect detected downstream is proof of instability upstream.

The Fundamental Reorientation Required
CURRENT MODEL — REACTIVE QUALITY (COSTLY) |
Raw Materials ➔ Unstable Process ➔ Produce Defects ➔ Downstream Inspect ➔ Sort / Rework / Scrap ➔ Ship Good Product |
TARGET MODEL — PROACTIVE QUALITY (PROFITABLE) |
Raw Materials ➔ Capable Process (Cpk ≥ 1.33) ➔ Build Quality In ➔ Minimal Audit Inspection ➔ Ship Good Product |
The difference is fundamental: in the proactive model, defects are prevented, not detected. The entire cost architecture changes. Inspection transitions from being a 'control mechanism' to a 'confirmation audit' — and eventually becomes nearly redundant.
The Four Pillars of Cpk ≥ 1.33 Implementation
Pillar 1 — Institutionalize Real-Time Statistical Process Control
SPC is not new technology. But in most steel plants, SPC is done sporadically, performed manually after the fact, executed on a sample basis, and completed without structured corrective action loops. This is SPC as reporting, not SPC as control. World-class plants treat SPC as an active management tool with real-time charts on every critical parameter, automated alarms when process drifts begin, immediate corrective action triggers, and closed-loop adjustment systems. The moment a parameter exhibits statistical drift — long before it approaches the actual product failure limit — the system flags an intervention.
Pillar 2 — Lock the Critical Process Variables
Steelmaking involves inherent variation, but the controllable variables must be standardized and locked. In the meltshop: chemistry targets, tap temperature, refractory condition, slag chemistry. In continuous casting: mold level, casting speed, cooling rates, EMS settings. In reheating: zone temperatures, residence time, atmosphere control. In rolling: stand speeds, roll gaps, tension control, cooling patterns. In heat treatment: furnace profiles, quench rates, tempering parameters. When one shift runs with discipline and another runs by experience alone, process capability will never hold. The management system must enforce identical control logic across operators, lines, and product families.
Pillar 3 — Stabilize Upstream First
Cpk improvement is not a downstream exercise. If the meltshop is unstable, the rolling mill will never achieve Cpk ≥ 1.33. Process mapping from raw materials to finished product, critical parameter identification at each step, capability assessment for each parameter, and improvement prioritization based on financial impact must all happen upstream. The upstream stability is the foundation on which all downstream quality rests.
Pillar 4 — Reduce Inspection Proportionally as Capability Improves
The ultimate goal is to make downstream inspection economically non-value-added — meaning the process is so capable that detection inspection no longer adds net value. When Cpk ≥ 1.33, automated NDT can be reduced or eliminated, lab testing can be scaled back to audit frequency, manual sorting can be eliminated entirely, and final inspection can focus on value-added activities. This creates a virtuous cycle: capability improvement funds further investment in process excellence.
A Worked Example — The EBITDA Uplift Calculation
PARAMETER | BEFORE (Cpk ≈ 0.95) | AFTER (Cpk ≥ 1.33) | IMPROVEMENT |
Annual Production | 500,000 TPA | 500,000 TPA | — |
Average Cpk (Critical CTQs) | 0.95 | 1.33+ | +0.38 points |
Scrap & Rework Rate | 3.8% of production | 0.9% of production | −76% reduction |
Annual COPQ | ₹54 Crore (~$6.5M) | ₹15 Crore (~$1.8M) | −72% reduction |
Inspection Labor Cost | ₹12 Crore/year | ₹4 Crore/year | −67% reduction |
Annual EBITDA Uplift | — | — | ≈ ₹47 Crore (~$5.6M) |
Numbers are illustrative based on industry benchmarks. Apply your plant's actual data to compute plant-specific ROI. The methodology is consistent; the scale will reflect your production volume and product mix.
SECTION 5
Technology & Innovation Layer: AI-Driven Capability Management

This is where Industry 4.0 transforms from buzzword to balance-sheet impact. Modern digital tools do not replace metallurgical judgment — they amplify it. The key is deploying technology in service of process capability, not as a substitute for it.
1. Physics-Informed AI and Predictive Quality Engines
Conventional SPC charts are highly effective but inherently limited to tracking one process variable in isolation. Advanced AI models can continuously analyze thousands of concurrent data streams — correlating furnace oxygen levels, ladle chemistry adjustments, continuous casting line speeds, and mill stand deformation forces in real time. Physics-Informed Machine Learning (PIML) combines first-principles metallurgical knowledge — CCT diagrams, diffusion kinetics, transformation thermodynamics — with machine learning to predict microstructure outcomes from process inputs. When a minor change in incoming alloy chemistry interacts with an unusual thermal profile in the rolling mill, the predictive engine calculates the localized microstructural impact instantly. The system automatically adjusts downstream cooling water flow rates or heat-treatment furnace transit speeds to compensate before any physical defect can form.
2. Automated SPC with Closed-Loop Control
Modern SPC systems are not passive monitoring tools — they are active control systems that continuously monitor process outputs, detect statistical violations in real time, automatically adjust process inputs within defined limits, and log every intervention for analysis and learning. The result: Cpk values are maintained at target levels rather than declining and being reactively recovered after defects emerge. Defect root-cause analysis (RCA) loops are compressed from several hours of manual review to minutes, establishing a highly responsive, near-zero-defect production environment.
3. Digital Twins for Process Simulation and Risk-Free Optimization
A digital twin of the steelmaking process allows engineers to simulate the impact of process changes on Cpk before risking production, test new operating parameters for new steel grades, identify root causes of Cpk degradation across complex multi-variable interactions, and train operators on optimal process settings in a risk-free environment. This is especially valuable in rolling, heat treatment, continuous casting, and controlled cooling — where the interaction between multiple parameters creates complex, non-linear outcomes that traditional analysis cannot resolve.
4. Computer Vision and Real-Time Surface Inspection
Modern computer vision systems provide real-time surface inspection at line speed, correlating visual defects with upstream parameter drift and feeding data directly into control loops. Unlike legacy inspection systems that require manual review, AI-powered vision systems classify defects instantaneously, calculate root-cause probability, and flag upstream process deviations that are likely to produce further nonconformances. This converts surface inspection from a detection activity into a real-time process control input.
5. Generative AI for Root Cause Analysis Acceleration
When Cpk falls below 1.33, time to restoration is critical. Generative AI and conversational interfaces can access historical production data and resolution records, suggest probable root causes based on pattern matching across thousands of previous events, guide engineers through structured problem-solving protocols, and accelerate CAPA and 8D documentation velocity. The competitive advantage: compressing root-cause analysis from days to minutes maximizes operational decision velocity and minimizes the financial impact of each process excursion.
IMPORTANT IMPLEMENTATION NOTE |
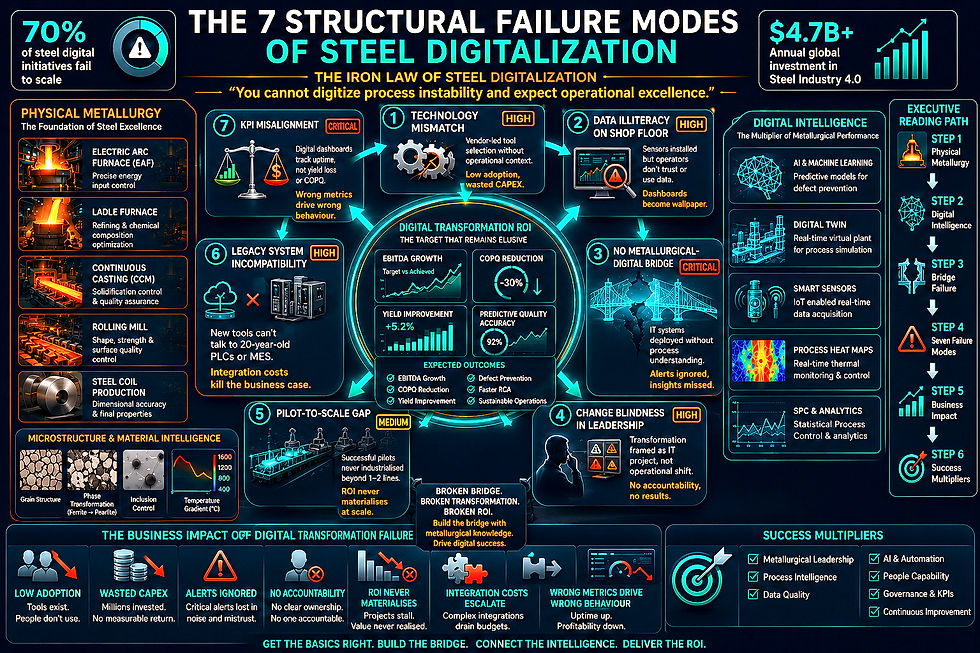
Technology is an enabler — not a substitute — for process discipline. Digital tools require high-quality, time-synchronized data to be effective. Plants must first define a clean quality signal through disciplined process control. Then use analytics to strengthen and sustain that control. Digitizing an unstable process produces unstable digital outputs — faster chaos, not faster quality. |
SECTION 6
Equipment, Machine & Process Modification
Process capability improvement requires physical system upgrades — not merely software and reporting changes. The following targeted engineering retrofits provide the continuous telemetry data required for automated process control and Cpk ≥ 1.33 performance.
Critical Sensor Infrastructure by Process Area
PROCESS AREA | CRITICAL SENSOR UPGRADES | CONTROL IMPROVEMENT | Cpk IMPACT |
Meltshop / EAF / LF | Optical emission spectrometers (OES), sublance temperature sensors, slag composition monitors | Real-time chemistry control, tap temperature precision | High — chemistry stability is foundation of all downstream Cpk |
Continuous Casting | Mold level sensors, thermal arrays, strand speed controllers, EMS feedback | Closed-loop strand quality control, reduced macro-defects | Very High — casting stability determines internal quality |
Reheating Furnace | Multi-zone thermocouples, optical pyrometers, O2 trim controls, atmosphere sensors | Zone-by-zone temperature uniformity, scale control | High — thermal uniformity determines microstructural consistency |
Rolling Mill | Load cells, position sensors, high-speed thermal cameras, laser gauge systems | Real-time roll gap control, dimensional feedback loops | Very High — dimensional Cpk depends entirely on mill control |
Laminar Cooling | Temperature arrays, high-resolution flow meters, header pressure controls | Consistent cooling rate → consistent mechanical properties | High — final properties determined here |
Heat Treatment Furnace | Multi-zone thermal profiles, quench intensity sensors, atmosphere monitoring | Recipe-based control with operator lockouts | Very High — hardness/microstructure Cpk controlled here |
Control System Retrofits
Legacy control systems with slow response times or limited data storage must be upgraded to modern architectures that provide millisecond-resolution data, support algorithmic control of process parameters, integrate with MES and analytics platforms, and enable remote monitoring and adjustment. The key principle: the control system response time must be faster than the rate of process drift. A system that detects a temperature excursion three minutes after it occurs cannot prevent a defect. Real-time closed-loop control prevents defects; delayed detection merely documents them.
Thermal Control Retrofits — Furnaces and Heat Treatment
Traditional gas-fired annealing and flame-hardening furnaces must be retrofitted with high-speed digital automated gas flow meters, multi-zone oxygen trim controls, and inline non-contact optical pyrometers. This eliminates cold boundary spots and ensures precise temperature uniformity throughout the heating cycle — directly attacking one of the most common root causes of heat treatment Cpk failure.
Quench System Engineering
Quenching oil and water circulation systems must be modified with automated variable frequency drive (VFD) pumps and real-time inline viscosity and temperature sensors. Stable heat-extraction rates across varying production loads are non-negotiable for consistent hardness profiles. A quench system that delivers inconsistent cooling rates will produce inconsistent hardness — regardless of how precise the heating cycle was.
Preventive Maintenance as a Cpk Protection Strategy
A machine that drifts mechanically will destroy process capability even when the metallurgical recipe is correct. A worn roll, drifting furnace zone, inconsistent quench system, or delayed actuator response all systematically degrade Cpk. Effective preventive maintenance requires predictive monitoring of vibration, temperature, and performance data, planned interventions before Cpk drops below 1.33, strategic spare parts availability for critical components, and post-maintenance Cpk verification as a standard work element.
SECTION 7

Global & ESG Relevance: Why Cpk ≥ 1.33 Is a Sustainability Imperative
The Cpk journey is not only a profitability story. In today's regulatory and market environment, it is also a sustainability and export competitiveness story that boards must understand at the strategic level.
Carbon Reduction Through Scrap Prevention
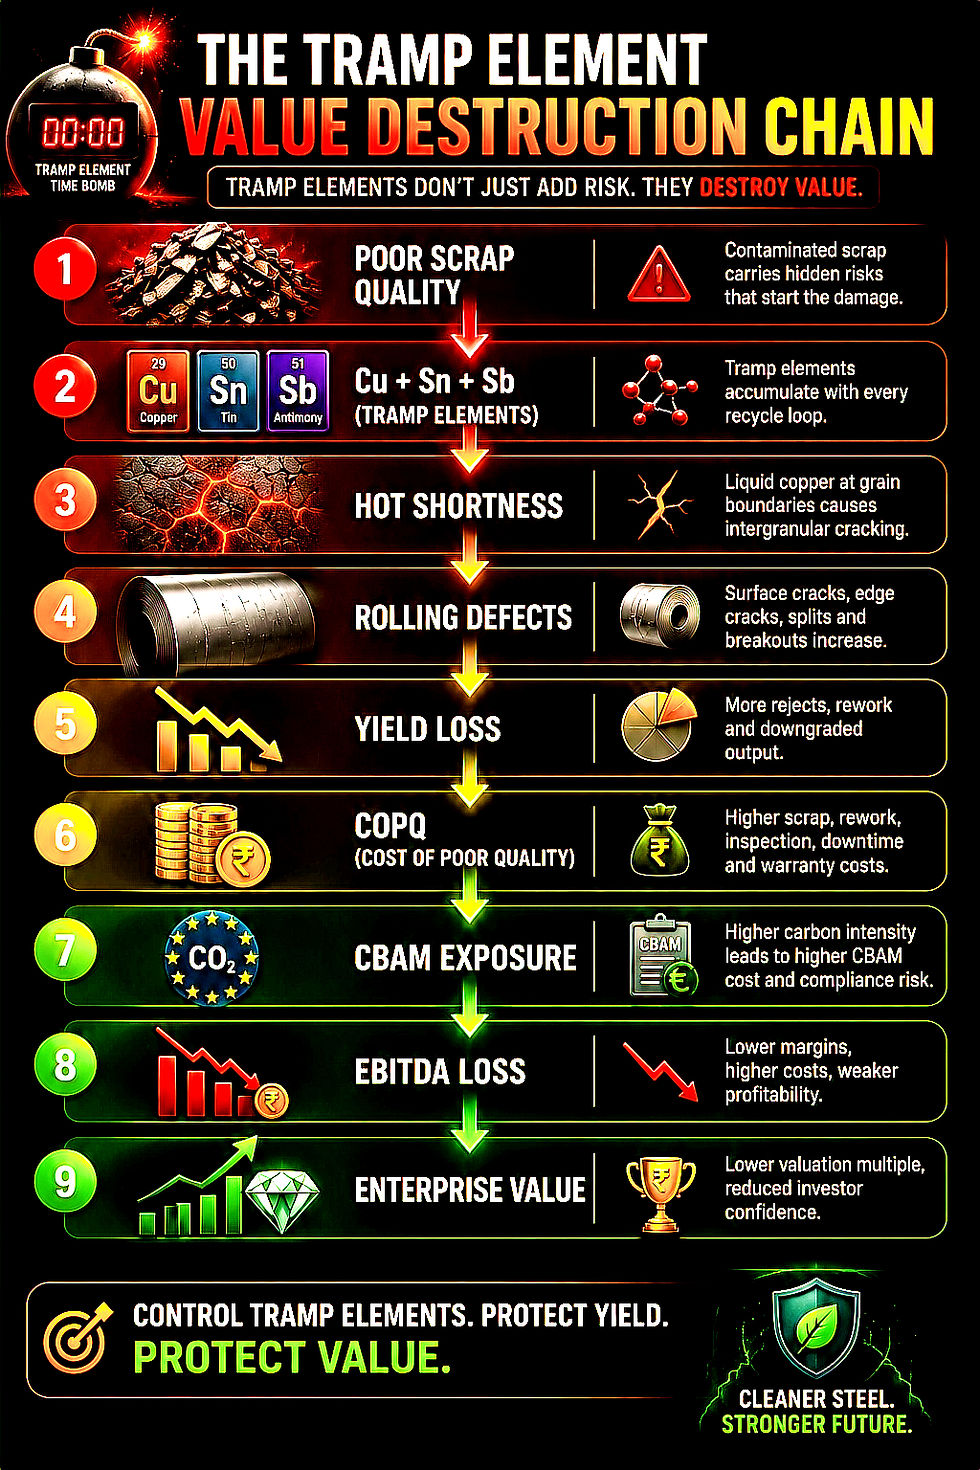
Every tonne of scrap generated in a steel plant represents embodied carbon from the original production cycle, additional carbon from collection, transportation, and energy-intensive EAF re-melting, and avoidable Scope 1 and Scope 3 emissions that appear directly on your carbon disclosure report.
THE Cpk-TO-CARBON MATHEMATICS |
A plant producing 1,000,000 tonnes/year at 95% yield generates 50,000 tonnes of internal scrap annually. |
At Cpk ≥ 1.33, yield improves to 96.5–97%, reducing scrap by 15,000–20,000 tonnes/year. |
At 3 tonnes CO₂e per tonne of steel re-melted, that is 45,000–60,000 tonnes CO₂e avoided annually. |
At current CBAM carbon pricing (~€75/tonne CO₂e), that represents €3.4–4.5 million in avoided carbon cost. |
CBAM Compliance Through Yield Improvement
Europe's Carbon Border Adjustment Mechanism (CBAM) imposes direct costs on carbon-intensive steel imports. Plants with higher process yield have structurally lower carbon intensity per saleable tonne — a permanent competitive advantage in regulated export markets. Many corporate boards assume meaningful decarbonization requires massive capital investment in green hydrogen DRI complexes. Driving process capability to Cpk ≥ 1.33 is a powerful, low-CapEx alternative that delivers measurable Scope 1 and 3 carbon reductions immediately.
CAPABILITY PATH | YIELD IMPACT | CARBON INTENSITY | CBAM EXPOSURE | EXPORT POSITION |
Low Cpk (~1.04) → High Scrap | ~95% | High — excess EAF re-melting | High tariff risk | Price-competitive disadvantage |
High Cpk (≥1.33) → Near-Zero Defect | ~97% | Low — first-time-right production | Minimal exposure | Preferred supplier status |
Supply Chain Resilience and Global Competitiveness
Customers in automotive, aerospace, energy, and critical infrastructure increasingly demand documented process capability as a qualification requirement. A demonstrable Cpk ≥ 1.33 certification provides supplier qualification advantage in tier-1 audits, reduced audit frequency and administrative burden from customers, preferred supplier status in high-value tenders, and competitive differentiation in global markets where capability is a contract requirement.
Plants that master process capability will be better positioned for resource efficiency compliance, supply chain resilience in an era of geopolitical disruption, sustainability reporting and ESG investor scrutiny, and customer confidence in markets where quality failures are unacceptable.
SECTION 8
Leadership Lesson: What the C-Suite Must Understand
THE CORE EXECUTIVE INSIGHT |
"Inspection is a cost center. Capability is an enterprise asset." |
Quality cannot be inspected into a product. It must be engineered into the process. |
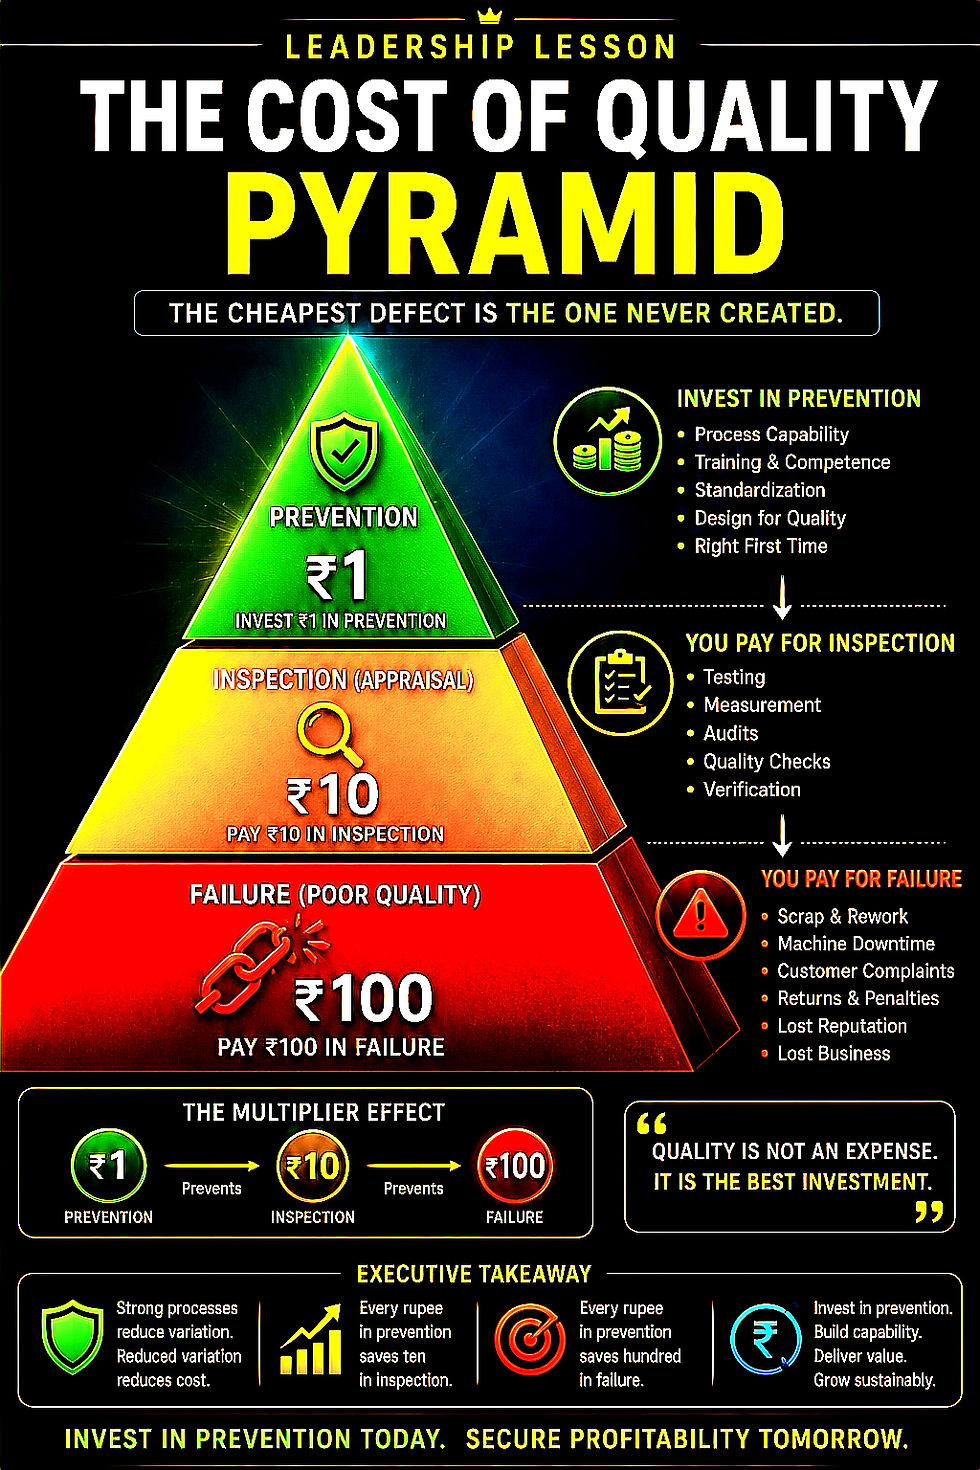
The Cost-of-Quality Hierarchy — Every Executive Must Know This
QUALITY STRATEGY | COST PER DEFECT | WHERE IT OCCURS | EXAMPLES |
Build Quality In (Prevention) | ₹1 | At source, before defect created | SPC, process control, operator training, design of experiments |
Inspect for Defects (Appraisal) | ₹10 | Internal, after cost incurred | NDT, lab testing, manual sorting, re-inspection |
Detect at Customer (Failure) | ₹100+ | External, maximum damage | Warranty claims, field failures, reputation loss, legal exposure |
Every rupee invested in process capability avoids ₹10–100 of downstream failure cost. This is not a quality department metric. This is a capital allocation decision that belongs on the CFO's and CEO's agenda.
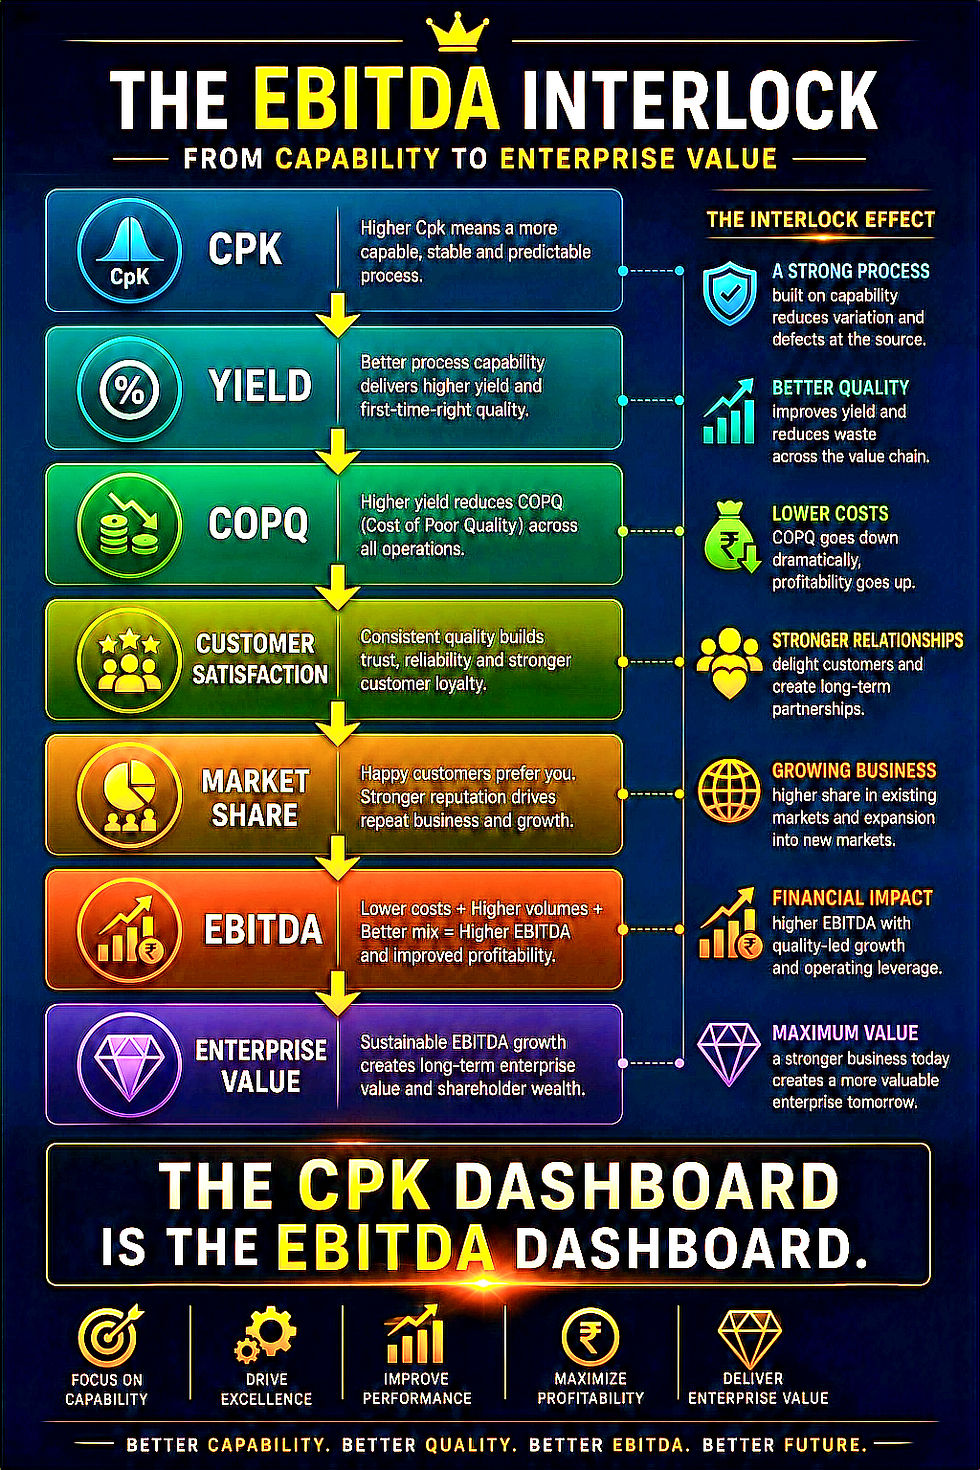
The Cpk Dashboard Is an EBITDA Dashboard
THE LEADERSHIP LEDGER |
Low Cpk (<1.33) ➔ High Internal Failure Loop ➔ Elevated COPQ ➔ EBITDA Erosion |
High Cpk (≥1.33) ➔ Predictable Operational Flow ➔ Low COPQ ➔ EBITDA Expansion |
Stop treating Cpk as a 'technical metric.' Start treating it as a financial performance indicator. A dashboard showing current Cpk by parameter, gap to Cpk ≥ 1.33 target, and the financial impact of each 0.01-point improvement is a boardroom tool, not an engineering tool. This is the shift that separates industrial leaders from industrial administrators.
Five Leadership Principles for the Capability Transformation
1. Stop funding inspection as the primary quality strategy. Redirect inspection budgets toward upstream process stabilization and SPC infrastructure.
2. Make Cpk a board-level KPI. If Cpk is not reported in the boardroom alongside EBITDA, yield, and COPQ, it will never become a strategic priority.
3. Assign cross-functional accountability. Quality cannot be the Quality Department's responsibility alone. Operations, Engineering, Procurement, and Finance all own Cpk.
4. Measure and reward prevention, not detection. Organizations that measure inspectors by defects caught incentivize the wrong behavior. Measure instead by first-time-right yield and COPQ reduction.
5. Set the ultimate goal: inspection elimination. If inspection is necessary, the process is not capable enough. The North Star is not 'better inspection' — it is 'no inspection needed.'
SECTION 9
Action Checklist: Five Immediate Steps for Execution
The following five actions can be initiated immediately. They require no capital approval, no major system investment, and no external consultants. They require leadership commitment and operational discipline.
01 | BASELINE CPK AUDIT — MEASURE WHAT MATTERS Identify all customer-critical characteristics (dimensions, properties, chemistry). Collect minimum 30 data points per parameter from current production. Calculate Cpk using appropriate statistical software. Create a baseline Cpk register for every CTQ parameter and rank by financial impact. This audit will reveal where money is being lost with precision. |
02 | PRIORITIZE THE HIGHEST-IMPACT LOW-CAPABILITY NODES Rank all parameters below Cpk 1.33 by three criteria: lowest Cpk value, highest financial impact (COPQ contribution), and highest customer complaint frequency. Target the top 3 parameters for immediate focused improvement. This Pareto approach generates 80% of the EBITDA uplift from 20% of the effort. Depth before breadth. |
03 | DEPLOY REAL-TIME SPC GATES ON PRIORITY PARAMETERS Integrate automated SPC software directly at primary production nodes. Configure control charts with automated alarm triggers for statistical anomalies (7 consecutive points drifting to one side, or a single parameter exceeding the 2σ warning limit). Train operators on SPC interpretation and establish corrective action protocols. Automate data collection wherever possible. Define a clear reaction plan for every out-of-control event. |
04 | UPGRADE SENSOR INFRASTRUCTURE AND MACHINE TELEMETRY Install or calibrate sensors for temperature, pressure, vibration, speed, chemistry, and dimensional monitoring at highest-variation process areas. Upgrade control systems to provide millisecond-resolution data. Integrate SPC data directly into existing HMIs. In many cases the weak point is not the algorithm — it is the quality of the sensor signal feeding it. Clean data is the prerequisite for effective AI. |
05 | ESTABLISH THE MONTHLY EXECUTIVE CAPABILITY REVIEW Create a board-visible monthly dashboard showing Cpk by CTQ parameter, COPQ trend, yield performance, and action status. Restructure corporate KPIs to establish COPQ reduction as a primary success metric for senior management. Track and report Cpk improvement alongside EBITDA at every board meeting. Celebrate wins. This governance step is what converts a one-time improvement into a permanent cultural transformation. |
SECTION 10
The Final Word: Build Capability, Build Value
The steel industry faces immense pressure — from decarbonization mandates, from globalization of supply chains, from digital disruption of traditional manufacturing, and from relentless margin compression. In this environment, every rupee of efficiency counts. Every tonne of avoidable scrap is a strategic liability. Every hour of unnecessary inspection is a competitive cost that better-managed competitors do not bear.
THE 0.29-POINT TRANSFORMATION |
The difference between Cpk 1.04 and Cpk 1.33 is not just 0.29 points. |
It is the difference between reactive survival and proactive leadership. |
Between cost recovery and cost avoidance. |
Between margin erosion and EBITDA expansion. |
Between customer complaints and customer loyalty. |
Between an inspection center and a profit center. |
The plants that master process capability will not just survive the competitive pressures ahead. They will thrive. They will capture market share from less capable competitors. They will command premium prices from customers who value supply reliability above all else. They will attract institutional investment from investors who recognize superior operational execution as a durable competitive advantage.
The path is clear and the tools are available:
● Measure what matters — Cpk across every critical-to-quality parameter
● Improve what is broken — upstream, at the source of variation
● Capability before inspection — prevent, do not detect
● Cpk ≥ 1.33 before cutting inspection — earn the right to reduce downstream cost
● Track COPQ reduction as the financial proof — report it to the board
STOP FUNDING INSPECTION. |
START FUNDING PROCESS CAPABILITY. |
The Cpk dashboard IS the EBITDA dashboard. |
And every mill floor is a financial instrument waiting to be tuned. |
"Continuous learning and process evolution are valuable only when seamlessly transformed
into measurable business outcomes, operational excellence, and sustainable enterprise value."
— Prashant Shankar Kshirsagar
Global Metallurgical & Quality Transformation Leader
Bachelore of Metallurgy | Lean Six Sigma | Industry 4.0 | EBITDA Performance Architecture
This blog is part of the Global Metallurgical Intelligence Series — written for CEOs, CFOs, Plant Heads, Quality Directors, and industrial investors who need metallurgical insight translated into business value.

Comments