

🌿 GREEN STEEL STARTS ON THE SHOP FLOOR :-

Updated: Jul 2
GLOBAL METALLURGICAL INTELLIGENCE SERIES | SUSTAINABILITY EDITION
Why Yield Optimization Is the Most Powerful Sustainability Strategy
The Zero-CapEx Path to Carbon Reduction — How Driving Final Product Yield to 96% Slashes CO₂/Tonne, Turns CBAM Compliance into Competitive Advantage, and Delivers Immediate EBITDA Expansion
SECTION 1 | EXECUTIVE SUMMARY |
The Boardroom Bottom Line — In 30 Seconds
THE FIVE TRUTHS EVERY BOARD MUST CONFRONT TODAY
DIMENSION | THE INCONVENIENT TRUTH |
The Business Problem | Steel boardrooms invest billions in hydrogen and CCUS while shop-floor yield losses silently inflate carbon intensity by 6–12% per sellable tonne — a sustainability crisis hiding inside operational inefficiency |
The Root Cause | Process variability, poor supplier control, weak SPC discipline, and capability gaps create avoidable scrap and re-melting loops that multiply energy and emissions per shipable tonne |
The Financial Impact | A plant producing 1 million tonnes/year at 95% yield loses 50,000 tonnes to scrap — representing 150,000 tonnes CO₂e and €11.3M in CBAM exposure annually at €75/tonne CO₂ |
The Solution | Drive Final Product Yield (FPY) to 96%+ through operational precision: real-time SPC, AI-assisted analytics, equipment retrofits, and supplier governance. Zero CapEx. Immediate returns. |
The Call to Action | Green steel does not start with hydrogen. It starts on the shop floor. Yield optimization is the most powerful, most immediate, and most profitable sustainability strategy available today. |
THE STRATEGIC INSIGHT THAT CHANGES EVERYTHING |
The greenest tonne of steel is not produced with the newest technology. |
It is the tonne that never had to be remade. |
SECTION 2 | THE INDUSTRIAL PROBLEM |
The Decarbonization Distraction

The $64 Trillion Misdirection
Walk into any steel industry conference today and you will hear the same refrain: 'Green hydrogen is the future.' 'Direct Reduced Iron is the answer.' 'Carbon capture will save us.' These technologies are important. They will be essential for deep decarbonization by 2050. But here is the uncomfortable truth that rarely appears in board presentations: these solutions are years away from commercial viability at scale, require hundreds of billions in global capital expenditure, and do absolutely nothing to address the millions of tonnes of CO₂ being wasted today through inefficient operations.
THE CARBON REALITY EVERY STEEL EXECUTIVE MUST KNOW |
◆ Steel accounts for 6.7–7% of total global CO₂ emissions |
◆ Steel contributes approximately 12% of India's total CO₂ emissions |
◆ The sector must reduce emissions by 20% by 2030 and 93% by 2050 for net zero |
◆ India's target: reduce emission intensity from 2.5 to 2.2 tonnes CO₂/tonne of steel by 2030 |
◆ CBAM took effect January 2026, imposing carbon charges on steel entering the EU |
◆ High-emission Indian steel producers face profit erosion of $60–160 per tonne through 2034 |
The Hidden Carbon Tax You Are Already Paying
Every steel plant in the world operates with an invisible self-imposed carbon tax — one that does not appear in emissions reports, carbon trading schemes, or sustainability disclosures. It is the tax of process inefficiency: the embodied energy, raw material cost, and CO₂ emissions locked inside every tonne of internal scrap, every rejected coil, every reworked bar, and every re-melted heat.
Consider a steel plant producing 1 million tonnes of finished steel annually at 95% Final Product Yield (FPY). That plant generates 50,000 tonnes of internal scrap and rejects per year. Each tonne of scrap represents embodied carbon from the original production cycle — mining, transportation, melting, refining — plus additional carbon from remelting and reprocessing. At 3 tonnes CO₂ per tonne of steel, that 50,000 tonnes of scrap represents 150,000 tonnes CO₂e of entirely avoidable emissions that never appear in any sustainability strategy document.
PLANT SCENARIO | YIELD | ANNUAL SCRAP | CO₂e FROM AVOIDABLE SCRAP | CBAM EXPOSURE (€75/T) |
Underperforming Plant | 90% | 111,000 t | 333,000 t CO₂e | €25.0 million |
Average Indian Plant | 93% | 75,000 t | 225,000 t CO₂e | €16.9 million |
Current Industry Avg. | 95% | 50,000 t | 150,000 t CO₂e | €11.3 million |
World-Class Target | 97% | 30,000 t | 90,000 t CO₂e | €6.8 million |
EBITDA Gap (95→97%) | +2.0% | −20,000 t saved | −60,000 t CO₂e saved | €4.5M saved annually |
The Five Stakeholders Bearing the Cost
◆ CEOs and Boards face the paradox: 'We invested millions in sustainability, yet carbon intensity has not budged' — because the problem is on the shop floor, not in the sustainability report
◆ CFOs struggle to justify billion-dollar green hydrogen projects while operational waste continues unchecked and CBAM penalties begin appearing on the P&L
◆ Plant Heads inherit processes where yield losses are accepted as 'normal' rather than targeted as avoidable waste with a precise carbon and financial price tag
◆ Sustainability Directors are measured by carbon intensity metrics they cannot control without operational transformation — a disconnect between sustainability strategy and manufacturing reality
◆ Exporters face CBAM penalties proportional to embedded carbon per tonne — the highest-emission, lowest-yield plants face the steepest penalties and first loss of market access
SECTION 3 | TECHNICAL ROOT CAUSE |
Where Yield Is Lost — The Metallurgical Reality

The Systemic Cascade of Losses
Yield loss in steelmaking is not a single point failure. It is a compounding cascade across every process step, each contributing its own carbon cost and financial penalty. Understanding where yield is lost — with metallurgical precision — is the first step to eliminating it permanently.
PROCESS AREA | TYPICAL YIELD | PRIMARY LOSS MECHANISMS | CARBON IMPACT SEVERITY |
Electric Arc Furnace (EAF) | 85–92% | Dust losses, slag oxidation, hot heel retention, sweeping losses, tramp element rejection | CRITICAL — losses here must be entirely re-melted, maximum CO₂ penalty |
Ladle Furnace / Secondary Metallurgy | 92–95% | Slag carryover, refractory wear, inclusion entrapment, temperature losses | HIGH — chemistry failures force restart or downgrade |
Continuous Casting (CCM) | 88–95% | Tundish skull losses, breakout events, slab crop shear, scale pit, mold instability | CRITICAL — CCM losses create both scrap and energy waste |
Reheating Furnace | 97–98% | Scale formation and oxidation at surface, atmosphere control failures | MEDIUM — scale loss adds carbon without value |
Hot Strip / Rolling Mill | 96–98.5% | Crop end losses, cobble events, edge cracking, dimensional rejects, surface defects | HIGH — rolling failures often force complete re-melt |
Heat Treatment | 97–99% | Hardness variation, distortion, microstructure non-conformance, temper cracking | HIGH — heat treat failures destroy finished value |
Finishing / Inspection | 97–99% | Dimensional rejects, surface defects, mechanical property failures at final test | MEDIUM — but represents maximum embedded value lost |
The Carbon Multiplier Effect — How Scrap Compounds Emissions
What makes yield loss uniquely damaging from a sustainability standpoint is the carbon multiplier effect. Unlike a simple linear cost, scrap creates a compounding carbon penalty that is invisible in most plant-level emission analyses.

THE COMPOUNDING CARBON CHAIN |
STEP 1 → Raw Material Extraction (Mining, Transportation, Beneficiation) → CO₂ INCURRED |
STEP 2 → Melting and Refining in EAF or BOF (2,000+ kWh/tonne) → CO₂ INCURRED |
STEP 3 → Casting, Rolling, Heat Treatment (Additional 400–800 kWh/tonne) → CO₂ INCURRED |
STEP 4 → Product FAILS SPECIFICATION → SCRAPPED OR REWORKED → ALL ABOVE CO₂ WASTED |
STEP 5 → Material RE-ENTERS EAF for Re-melting (Back to Step 2) → CO₂ DOUBLED |
A yield improvement from 95% → 97% breaks this loop for 20,000 tonnes/year, saving ~60,000 tonnes CO₂e. |
The Metallurgical Mechanisms Behind Yield Loss
1. Inclusion and Segregation Defects
Non-metallic inclusions and chemical segregation (macro-segregation in the casting strand, micro-segregation in the solidifying dendrites) cause surface and internal defects that trigger rejects during rolling or downstream processing. In high-carbon and alloy steel grades such as C-60, C-70, or SAE 52100, if chemical boundaries are loosely controlled or cooling parameters vary dynamically across the strand, structural non-uniformities such as dense centerline carbide segregation or localized carbide banding will develop at the core. During subsequent thermomechanical processing or rapid flame hardening, these segregated regions exhibit erratic phase transformation velocities relative to the surrounding matrix, translating into high localized internal stress states and macroscopic quench cracking — and ultimately scrap.
2. Thermal Cycle Variability
Inconsistent furnace soak times, quench non-uniformity, and cooling rate variation produce out-of-specification microstructures and dimensional instability. A reheating furnace with inadequate zone temperature control creates both decarburization (surface carbon loss creating a soft skin) and scale formation (direct material loss through oxidation). Every degree of temperature deviation from optimal has a measurable yield cost.
3. Tramp Elements in Scrap Feedstock
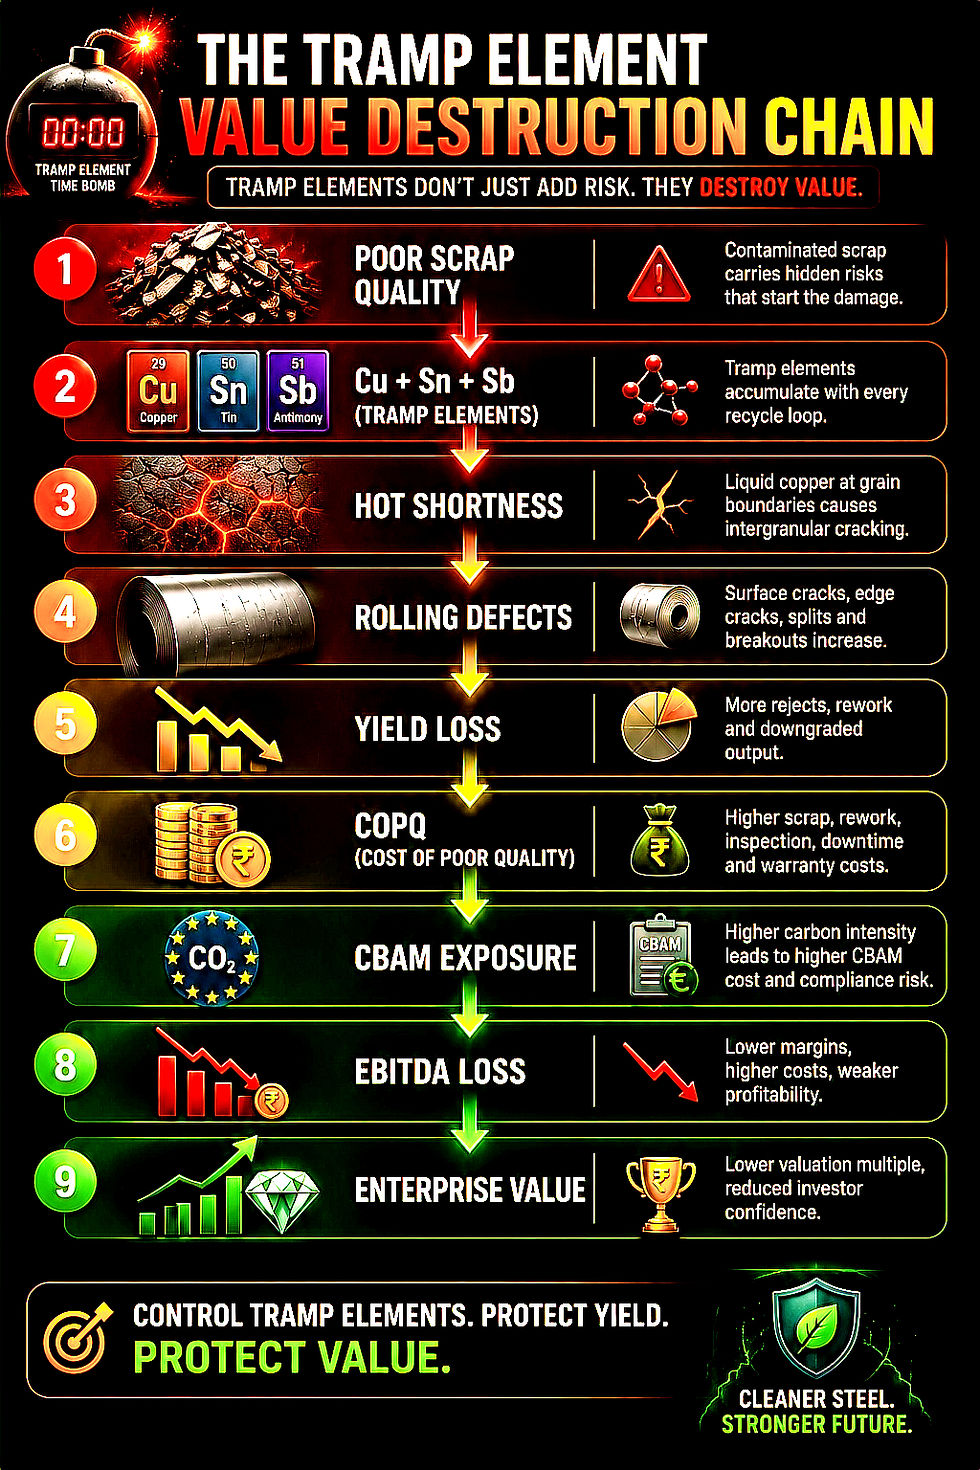
Copper, tin, lead, and other tramp elements in recycled scrap feedstock cause hot shortness (intergranular cracking at grain boundaries during high-temperature rolling), surface tearing, and downstream rejection in EAF routes. These elements are thermodynamically impossible to remove in conventional steelmaking — once in the melt, they stay. Poor scrap quality control at intake is a root cause of yield loss that no amount of downstream process control can fully compensate.
4. Process Capability Deficiency — The Statistical Root
At the statistical level, yield loss is the direct consequence of low process capability (Cpk < 1.33). When the natural variation of a process parameter — casting speed, mold temperature, rolling force, cooling rate — is large relative to the specification limits, the distribution tail inevitably extends past the acceptable boundary. This is not a random event. It is a mathematically predictable consequence of operating with insufficient process capability. Low Cpk in any critical parameter upstream creates guaranteed yield loss downstream.
FOR THE NON-METALLURGIST — THE BREAD OVEN ANALOGY |
TECHNICAL EXPLANATION: Final Product Yield (FPY) measures the percentage of liquid metal that emerges as fully certified, shippable product. Variances in process parameters generate structural non-conformances, forcing crop losses and re-melting cycles. |
PLAIN-LANGUAGE INTERPRETATION: Imagine baking 100 loaves of bread using the same electricity, ingredients, labor, and oven time. If 5 loaves must be discarded because the oven temperature fluctuated and the crust burned, the environmental footprint of those 5 loaves still exists — the electricity was consumed, the ingredients were used, the carbon was emitted. You paid the environmental price but received no customer value. Steel manufacturing operates under the same principle: scrap is not merely a quality issue. It is a sustainability failure. |
BUSINESS IMPLICATION: Every percentage point of yield improvement simultaneously reduces carbon intensity, manufacturing cost, and resource consumption while increasing profit. Very few industrial initiatives deliver all four outcomes at once. |
SECTION 4 | STRATEGIC INTERVENTION |
From Carbon Reporting to Carbon Prevention

The Fundamental Strategic Reframe
CONVENTIONAL APPROACH (Expensive & Slow) | YIELD-FIRST APPROACH (Immediate & Profitable) |
Invest billions in hydrogen DRI | Improve existing process control — zero CapEx |
Purchase carbon credits to offset emissions | Reduce scrap generation at source |
Install carbon capture infrastructure | Prevent defects from forming in the first place |
Wait for green technology maturity (2030–2040) | Act now with existing capabilities and data |
Report emissions while operational waste continues | Eliminate operational waste and report the savings |
Treat sustainability as a cost center | Convert sustainability discipline into EBITDA gain |
The Strategic Objective — One Sentence
Produce More Saleable Steel From Every Tonne Produced. |
This single objective simultaneously improves EBITDA, reduces carbon intensity, lowers CBAM exposure, and strengthens customer relationships. No other sustainability strategy delivers all four outcomes in a single initiative. |
The Five Pillars of Yield-First Sustainability
Pillar 1 — Make FPY an ESG KPI, Not an Operations Metric
The most powerful first step costs nothing: reclassify Final Product Yield as a primary sustainability indicator alongside Scope 1 and Scope 2 emissions. Report FPY and CO₂/tonne per sellable tonne on every board dashboard. When yield appears next to carbon intensity on the same executive report, the connection between operational discipline and environmental performance becomes impossible to ignore. This governance change alone redirects organizational attention to where carbon reduction is actually achievable.
Pillar 2 — Strengthen Process Capability as a Carbon Strategy
The statistical root of yield loss is process variability. The solution is process capability governance: achieving and maintaining Cpk ≥ 1.33 on all critical-to-quality (CTQ) parameters — chemistry, temperature, dimensional stability, cooling rate, casting speed. Every 0.1-point improvement in Cpk on a high-impact parameter reduces yield loss at that stage, translating directly into lower scrap generation and lower carbon intensity per saleable tonne. SPC must transition from a reporting tool to an active control mechanism with real-time automated alarms and defined corrective action protocols.
Pillar 3 — Attack Chronic Yield Losses with Pareto Precision
Not all yield losses are equal. A Pareto analysis of scrap generation will typically reveal that 3–5 defect categories account for 70–80% of total yield loss. These chronic losses are often caused by a small number of unstable process parameters, weak equipment conditions, or poor operational practices that have become normalized over time. Identifying and permanently eliminating these chronic loss sources — through root cause analysis (8D, CAPA, fishbone methodology) rather than temporary containment — delivers the majority of the yield improvement with a fraction of the effort.
Pillar 4 — Tighten Supplier Quality Gates
In EAF operations, the quality and composition of incoming scrap is the first — and often most impactful — variable affecting yield. Tramp elements in scrap (copper, tin, lead, arsenic) are metallurgically impossible to remove during conventional steelmaking. Poor incoming material creates yield loss that no amount of downstream process control can fully correct. Enforcing strict supplier control plans, implementing incoming scrap sorting with handheld XRF or OES analyzers, and requiring mill test certificates with forensic audit sampling protects yield at its source.
Pillar 5 — Link Incentives to Yield and CO₂/Tonne Simultaneously
Organizations measure what they reward. Tying operations and procurement KPIs to yield improvement and CO₂/tonne reduction — not just throughput volume and cost per tonne — fundamentally changes the behavior of plant leaders, shift managers, and procurement teams. When a shift manager's performance review includes yield percentage and associated carbon impact, the operational culture aligns around waste prevention rather than just tonnage output.
A Worked Example — The Full EBITDA and Carbon Impact
METRIC | BASELINE (95% YIELD) | TARGET (97% YIELD) | ANNUAL IMPROVEMENT |
Annual production (saleable) | 950,000 tonnes | 970,000 tonnes | +20,000 tonnes |
Internal scrap generated | 50,000 tonnes | 30,000 tonnes | −20,000 tonnes saved |
CO₂e from avoidable scrap | 150,000 tonnes CO₂e | 90,000 tonnes CO₂e | −60,000 tonnes CO₂e |
CBAM exposure (€75/t CO₂) | €11.25 million | €6.75 million | €4.5M saved |
Scrap processing cost saved | — | — | ~₹15–20 Cr/year |
Additional revenue (20K tonnes) | — | — | ~₹150–250 Cr/year |
COPQ reduction (30–60%) | — | — | ₹40–80 Cr/year |
TOTAL ANNUAL EBITDA UPLIFT | — | — | ₹200–350 Cr+ |
Numbers are illustrative. Apply plant-specific data for exact ROI. The directional logic is consistent across plant sizes and product mixes.
SECTION 5 | TECHNOLOGY & INNOVATION LAYER |
The Rise of Digital Sustainability — AI, Sensors & Smart Yield

Industry 4.0 technologies are creating genuinely new opportunities to improve yield and reduce carbon intensity simultaneously — at a speed and precision that manual management systems cannot match. The key is deploying these tools in service of process capability, not as a substitute for it.
1. Physics-Informed AI (PIML) — Prediction Before the Defect Forms
Physics-Informed Machine Learning (PIML) combines first-principles metallurgical knowledge — Continuous Cooling Transformation (CCT) diagrams, diffusion kinetics, solidification thermodynamics — with machine learning models trained on plant data. The result is a predictive quality engine that can forecast microstructure outcomes, defect risk, and yield probability from process inputs before the material leaves the furnace or casting strand.
Example capability: If an incoming alloy heat has a slightly elevated manganese content and the rolling mill thermal profile shows a temperature drop in the roughing stand, a PIML model can calculate the interaction effect on hardenability, predict a risk of centerline segregation, and recommend a compensating adjustment to the soaking time or finishing temperature — before the tonne becomes scrap.
2. AI-Powered Predictive Quality and Anomaly Detection
Machine learning models trained on historical yield loss events can identify the subtle process parameter combinations that precede defect formation — typically hours or minutes before a visible quality failure occurs. A comprehensive ferroalloy optimization model that incorporates prediction algorithms for alloying element yield increased the control rate of high-quality product conformance from 46% to 79%, directly reducing ferroalloy consumption while improving yield. This class of AI does not replace metallurgical judgment; it gives metallurgists a 24/7 real-time monitoring partner that never fatigues and never misses a trend.
3. Smart Melt Shop Solutions and Digital Control Platforms
Digital platforms that detect and eliminate equipment or process bottlenecks in real time can improve throughput, reduce energy usage, and lower emissions simultaneously. ABB's Smart Melt Shop solution at JSW Steel's Dolvi Works plant demonstrated a boost of $2 million per annum in profits through 4% higher casting speeds and additional output of 24,000 tonnes per year — entirely through digital process optimization, with no greenfield capital investment. The return on investment for such platforms typically manifests within 6–18 months when focused on high-value product lines.
4. Computer Vision for Surface Defect Detection and Root Cause Correlation
Advanced computer vision systems provide real-time surface inspection at line speed, automatically classifying defects, calculating root-cause probability, and flagging upstream process deviations likely to produce further nonconformances. Unlike legacy inspection systems that trigger manual review after significant output has been produced, AI-powered vision systems convert surface inspection from a downstream detection activity into an upstream process control feedback signal.
5. Digital Twins for Zero-Risk Process Optimization
Digital twins of the steelmaking process allow engineers to simulate the effect of process parameter changes on yield and carbon intensity before committing to live production trials. Rolling schedules, cooling strategies, heat-treatment cycles, casting parameters — all can be tested in the digital environment first. This is especially valuable when introducing new steel grades, optimizing for CBAM-sensitive carbon intensity targets, or evaluating equipment retrofit options. The carbon savings from eliminating failed production trials alone often justify the digital twin investment.
6. Automated FPY Dashboards Linking Yield to Carbon and Cost
The most immediately impactful technology investment is often the simplest: an integrated executive dashboard that displays FPY by product family, process stage, shift, and equipment line — alongside the corresponding carbon intensity and COPQ impact. When a line, shift, or machine generates abnormal yield losses, the team should know immediately. The dashboard should automatically convert each point of yield loss into its equivalent in CO₂e, energy cost, and CBAM exposure. This is how metallurgical improvement becomes a real-time ESG story with auditable numbers, not annual sustainability report slogans.
TECHNOLOGY IMPLEMENTATION PRINCIPLE |
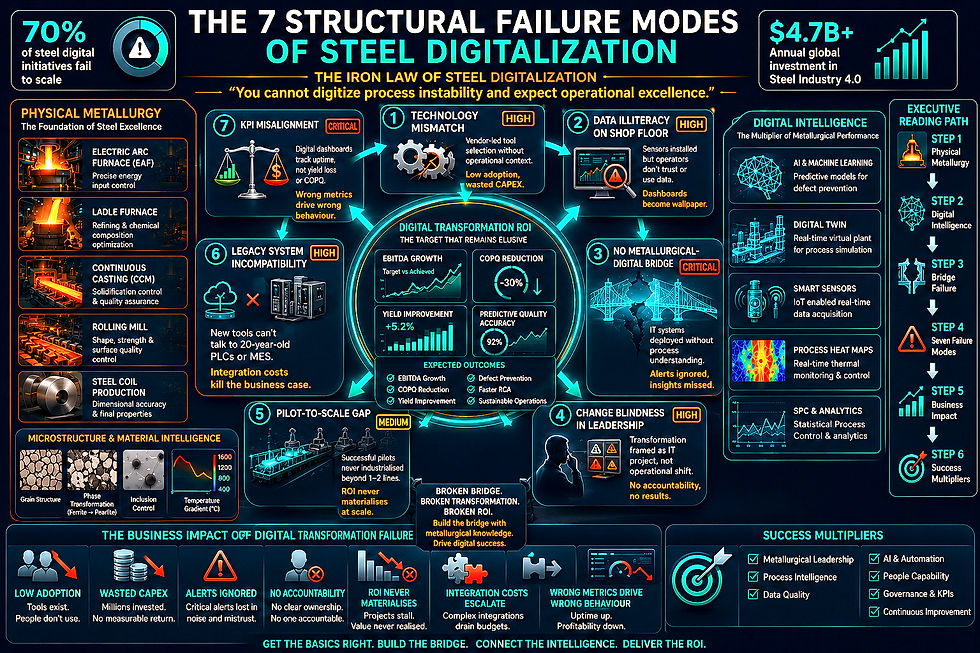
Technology is an enabler — not a substitute — for process discipline. Digital tools require high-quality, time-synchronized data to be effective. The correct sequence is: first, stabilize the process; second, instrument it; third, apply analytics; fourth, automate the response. Digitizing an unstable process produces unstable digital outputs. Faster chaos is not faster quality. |
SECTION 6 | EQUIPMENT & PROCESS MODIFICATION |
Plant-Level Improvements That Move the Yield Needle

Yield optimization often requires targeted physical improvements — not merely software and reporting changes. The following engineering modernizations address the root causes of yield loss at the machine level, providing the clean continuous data and precise physical control that makes AI analytics effective and process capability sustainable.
EQUIPMENT AREA | SPECIFIC MODIFICATION | YIELD IMPACT | CARBON IMPACT |
Meltshop / EAF | Electromagnetic stirring (EMS) retrofit; automated chemistry control via OES feedback; scrap pre-sorting with handheld XRF | Metallic charge yield +3–5%; tramp element rejection reduced 40–60% | Reduces re-melt loops; Acciaieria Arvedi saw 5% productivity gain, 3.6% energy reduction |
Ladle / Secondary Metallurgy | Slag detection systems at ladle-to-tundish transfer; automated slag cut-off; argon stirring optimization | CCM yield improved 2.4% in two steps; 60% reduction in yield loss from slag carryover at one facility | Prevents unnecessary re-heats; reduces inclusion-driven downstream scrap |
Continuous Casting | Mold level control upgrade; dynamic secondary cooling; breakout prevention systems; tundish thermal management | Casting speed +4% (JSW Dolvi ABB case); slab crop losses reduced; breakout rate near zero | 24,000 tonnes/year additional output from same energy; fewer complete strand scraps |
Reheating Furnace | Multi-zone oxygen trim controls; non-contact optical pyrometers; waste heat recovery systems; residence time optimization via scheduling AI | Scale formation reduced 15–25%; dimensional consistency improved | Tata Steel: 22,000 tonnes CO₂e saved annually from waste heat recovery at single site |
Rolling Mill | Laser thickness profile gauges; automatic gauge control (AGC); improved guide alignment; roll condition monitoring with vibration sensors | Crop losses and cobble frequency reduced 40–70%; dimensional rejects near eliminated | Fewer cobble events = fewer complete re-melt events; direct yield = direct carbon |
Heat Treatment | Digital recipe management with operator lockouts; high-speed quench system upgrades with VFD pumps and viscosity sensors; multi-zone furnace profiling | Hardness variation reduced; rework rate drops 50–80% on heat-treated product | Fewer re-treat cycles; lower energy per good tonne; reduced scrap generation |
The Slag Detection Breakthrough — A Case Study in Zero-CapEx Yield Recovery
Remaining liquid steel in ladles or slag pots at the ladle-to-tundish transfer point has historically been one of the largest single sources of yield loss at the CCM. When operators are uncertain whether remaining volume is liquid steel or slag, the conservative decision is to cut the flow early — losing valuable steel. Slag detection systems using electromagnetic sensors or image analysis resolve this uncertainty instantly, allowing operators to extract maximum liquid steel before slag carryover begins.
The impact at documented installations has been dramatic: a 60% reduction in yield loss from this single source alone, achieved with a modest sensor installation. Combined with operator training on slag management and automated cut-off systems, this intervention typically delivers a payback period of 3–6 months. The carbon benefit: every additional tonne of steel recovered from a heat that would otherwise have gone to scrap and re-melt represents a 3 tonne CO₂e saving — permanently.
Scrap Sorting and Preparation — The Upstream Carbon Shield
In EAF operations, poor scrap preparation and mixed scrap grades are the upstream root cause of yield losses that no downstream process control can fully address. Mechanical sorting systems, handheld XRF analyzers for incoming scrap screening, and sensor-based sorting for tramp element detection represent a category of investment that pays back through yield improvement, not through better throughput. Plants that implement rigorous scrap quality programs typically see EAF yield improvements of 1–2% — representing, for a 500,000 tonne plant, 5,000–10,000 tonnes per year of recovered product and 15,000–30,000 tonnes CO₂e avoided.
SECTION 7 | GLOBAL, ESG & FUTURE RELEVANCE |
Why Yield Optimization Is the Ultimate ESG Strategy
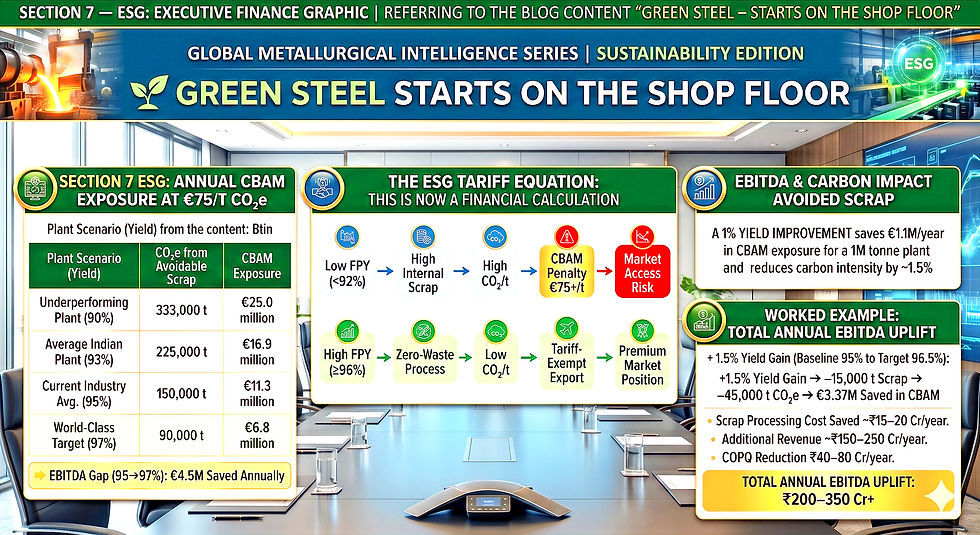
The CBAM Equation — Carbon Has a Price Tag Now
Europe's Carbon Border Adjustment Mechanism (CBAM) has transformed carbon intensity from an abstract environmental metric into a hard financial variable. With CBAM currently priced at approximately €75.36 per tonne of CO₂e, the embedded carbon in every tonne of exported steel now carries a direct, auditable cost that appears on every invoice and shipment to the EU. More than 60% of Indian steel exports head to European markets — making CBAM compliance not a future regulatory risk, but a present competitive reality.
THE ESG TARIFF EQUATION — THIS IS NOW A FINANCIAL CALCULATION |
Low FPY (<92%) → High Internal Scrap → High CO₂/t → CBAM Penalty €75+/t → Market Access Risk |
High FPY (≥96%) → Zero-Waste Process → Low CO₂/t → Tariff-Exempt Export → Premium Market Position |
A 1% yield improvement reduces carbon intensity by ~1.5% and saves €1.1M/year in CBAM exposure (1M tonne plant). |
The Carbon Mathematics — Definitive Numbers for the Board
SCENARIO | ANNUAL PRODUCTION | YIELD | SCRAP GEN. | CO₂e FROM SCRAP | CBAM COST |
Baseline | 1,000,000 t | 95% | 50,000 t | 150,000 t CO₂e | €11.25M |
After 1.5% Yield Gain | 1,000,000 t | 96.5% | 35,000 t | 105,000 t CO₂e | €7.88M |
ANNUAL SAVINGS | — | +1.5% | −15,000 t | −45,000 t CO₂e | €3.37M saved |
Supply Chain Resilience and Export Competitiveness
The geopolitical reality of 2026 is this: global steel buyers are actively qualifying and preferring suppliers with documented, auditable low-carbon production processes. A Cpk-governed, yield-optimized plant with real-time SPC documentation and a verifiable CO₂/tonne reduction trajectory is a fundamentally more attractive supply partner than a plant with a green hydrogen commitment and a 2040 timeline. Yield optimization delivers the ESG credentials that generate commercial advantage today, not in the next decade.
Resource Efficiency — The Circular Economy Argument
Yield optimization is the most powerful enabler of circular economy principles in steelmaking. Every tonne of scrap avoided means less iron ore or scrap feedstock consumed per saleable tonne, less energy converted to heat and lost as waste, less water used per production cycle, and less waste material requiring disposal or reprocessing. These resource efficiency gains compound directly into cost reduction, sustainability performance improvement, and supply chain resilience — simultaneously reducing exposure to raw material price volatility and import dependency.
National Policy Alignment — India's 2030 Carbon Intensity Target
India's commitment to reduce steel sector carbon emission intensity from 2.5 to 2.2 tonnes CO₂/tonne of steel by 2030 requires an 12% reduction in emission intensity within 5 years. Green hydrogen DRI at commercial scale will not deliver this by 2030. Yield optimization can. A plant that improves FPY from 93% to 96% reduces its emission intensity per saleable tonne by approximately 4.5–6% — contributing meaningfully to the national target through operational precision, without waiting for infrastructure that does not yet exist at commercial scale.
SECTION 8 | LEADERSHIP LESSON |
What CEOs, Sustainability Officers, and Plant Leaders Must Learn
(Sustainability is not a technology strategy.
It is an operational excellence strategy.)
THE CORE EXECUTIVE INSIGHT |
"Sustainability is not a separate regulatory box to be checked. |
It is the ultimate expression of operational discipline." |
The leadership question must change from: 'How do we spend more money becoming sustainable?' to: |
'How do we eliminate waste so effectively that sustainability becomes a natural outcome of operational excellence?' |
Five Leadership Principles for the Yield-First Sustainability Revolution
1. Green steel does not start with hydrogen — it starts on the shop floor. The most powerful sustainability strategy is not waiting for technology readiness. It is optimizing what you already have. Every percentage point of yield loss is a carbon emission that could have been avoided through better process discipline.
2. Stop chasing silver bullets. Start fixing what is broken. Before investing billions in green hydrogen, invest millions in process capability. The ROI is faster, the risk is lower, and the carbon reduction is immediate. Hydrogen has its place — but not as a substitute for operational excellence.
3. Sustainability is not a cost center — it is a profit center. Yield optimization delivers simultaneously: lower manufacturing costs, lower carbon emissions per tonne, higher revenue (premium pricing for certified low-carbon steel), and lower CBAM tariff exposure. The business case is compelling from every angle.
4. The Yield Dashboard IS the ESG Dashboard. Stop treating yield as an operations metric and start treating it as a sustainability performance indicator. A board dashboard showing FPY by product line, CO₂/tonne per process step, CBAM exposure by product, and the financial impact of each 0.1% yield improvement is an ESG governance tool, not an engineering report.
5. The path to net zero runs through operational excellence, not just capital investment. The steel industry must reduce emissions 20% by 2030. Hydrogen and carbon capture will not be ready at scale. Yield optimization is ready today, deployable now, and measurably effective within months.
The Leadership Ledger — The Choices That Define Industrial Leaders
LEADERSHIP CHOICE | SHORT-TERM COST | LONG-TERM CONSEQUENCE |
Fund downstream inspection instead of yield improvement | Inspectors, lab costs, sorting labor | Yield losses persist; CBAM exposure grows; carbon intensity unchanged |
Wait for hydrogen economics to improve | Nothing spent — but opportunity lost | CBAM penalties mount; customers shift to lower-carbon suppliers; competitive position weakens |
Invest in yield optimization and SPC | Sensor upgrades, training, software: 6–18 month payback | Yield improves, carbon intensity drops, CBAM exposure shrinks, EBITDA expands permanently |
Make FPY an ESG KPI and board metric | Governance change — minimal cost | Organizational focus aligns; yield improvement becomes self-sustaining cultural priority |
Implement supplier quality governance | XRF analyzers, audit program: modest investment | Tramp element rejection drops; EAF yield improves; scrap rework loops reduced permanently |
SECTION 9 | ACTION CHECKLIST |
Five Immediate Actions for Industrial Leaders

The following five actions can be initiated immediately. They require no capital approval, no major system investment, and no external regulatory guidance. They require leadership commitment and operational focus.
01 | ESTABLISH THE TRUE MATERIAL MASS BALANCE — MEASURE EVERY LOSS POINT Launch a plant-wide forensic audit to calculate the precise current FPY across all critical process steps: EAF → Ladle → CCM → Reheating → Rolling → Heat Treatment → Finishing. Identify the exact geographic points where material yield is lost to cropping, trimming, and internal rejection. Calibrate all weighing systems — inaccurate scales are a primary source of hidden yield loss that corrupts every subsequent analysis. Express each loss point in three currencies simultaneously: tonnes of yield lost, CO₂e emitted, and CBAM tariff exposure at current carbon prices. |
02 | LINK YIELD METRICS DIRECTLY TO CARBON INTENSITY AND CBAM EXPOSURE Calibrate operational dashboards to automatically convert every tonne of internal scrap generation into its precise equivalent in CO₂e emitted and euros of CBAM tariff exposure. Create a single-page executive view that places yield loss, COPQ, carbon intensity, and CBAM exposure on the same dashboard alongside EBITDA performance. When leadership sees that 1,000 tonnes of avoided scrap equals 3,000 tonnes CO₂e and €225,000 in CBAM savings, the operational priority becomes crystal clear. Report this dashboard monthly at board level — not annually in a sustainability report. |
03 | DEPLOY REAL-TIME SPC GATES ON THE HIGHEST-YIELD-IMPACT PARAMETERS Mandate that no manufacturing run for high-carbon or alloy steel grades begins until automated SPC metrics verify a stable process capability baseline of Cpk ≥ 1.33. Identify 8–12 critical-to-quality (CTQ) parameters across the value chain — chemistry, mold level, casting speed, furnace temperature, cooling rate, rolling tension — and install real-time monitoring with automated statistical alarms. Configure the system so that any parameter showing statistical drift triggers an immediate corrective action response before the drift translates into a defect and a yield loss. This is the single highest-ROI intervention in the entire action checklist. |
04 | UPGRADE CRITICAL SENSOR INFRASTRUCTURE AND MACHINE TELEMETRY Retrofit legacy furnace lines and rolling infrastructure with high-speed automated gas flow meters, multi-zone thermal sensors, and non-contact inline gauging systems. Install OES or XRF sampling points at critical melt stages to reduce chemistry correction lag. Upgrade quench systems with VFD pumps and temperature homogenizers. Equip rolling mill stands with laser thickness profile gauges and eddy current testing arrays. In many plants, the weak point is not the analytics algorithm — it is the quality of the sensor signal feeding it. Clean data is the foundation of effective AI; sensor infrastructure investment enables everything else. |
05 | REALIGN MANAGEMENT KPIs — MAKE YIELD AND CO₂/TONNE PERFORMANCE METRICS Adjust executive performance incentives to establish the optimization of Final Product Yield (FPY) to a minimum 96% standard and a measurable CO₂/tonne reduction trajectory as primary metrics for operational bonuses. Create a monthly Executive Yield and Sustainability Review that is board-visible, with Cpk by CTQ, FPY by product line, COPQ trend, and carbon intensity clearly displayed. Launch a 90-day yield audit on the top three product families where scrap and rework drive the highest emissions and cost, then a supplier forensic program requiring incoming scrap certificates with random forensic sampling for tramp elements. |
SECTION 10 | CLOSING SIGNATURE |
The Final Word: The Shop Floor Is the Starting Line

The global steel industry stands at a critical inflection point. CBAM is now in effect. Carbon prices are rising. Customers are actively demanding certified low-carbon steel. ESG investors are scrutinizing operational sustainability evidence, not just capital commitment announcements.
Yet most boardrooms are still looking in the wrong direction. They are waiting for hydrogen. They are investing in carbon capture. They are purchasing carbon credits. All of these have their place in the long-term decarbonization architecture. But none of them address the 150,000 tonnes of CO₂e that a typical 1 million-tonne plant emits today through avoidable scrap and yield loss — CO₂e that could be eliminated through operational precision, without a single rupee of greenfield capital expenditure.
THE MOST POWERFUL SUSTAINABILITY STRATEGY IS NOT A TECHNOLOGY. |
IT IS A DISCIPLINE. |
It is measuring what matters. Fixing what is broken. Optimizing what you already have. |
It is recognizing that every percentage point of yield improvement IS a percentage point of carbon reduction. |
The plants that master yield optimization will not just survive the carbon transition. They will define it. They will capture market share from less capable competitors. They will command premium prices from sustainability-conscious customers. They will attract investment from ESG-focused investors who recognize operational discipline as a more durable competitive advantage than a technology roadmap.
They will do all of this without waiting for a silver bullet. Because the most powerful tool for green steel already exists in every plant — it is the precision of the process, the discipline of the operators, the rigor of the SPC system, and the commitment of the leadership to measure yield as an environmental performance indicator, not just a production statistic.
GREEN STEEL DOES NOT START WITH HYDROGEN. |
IT STARTS ON THE SHOP FLOOR. |
Every defect prevented is carbon avoided. |
Every tonne of scrap eliminated is a tonne of CO₂e saved. |
Every percentage point of yield gained is a percentage point of planet protected. |
"Continuous learning and process evolution are valuable only when seamlessly transformed
into measurable business outcomes, operational excellence, and sustainable enterprise value."
— Prashant Shankar Kshirsagar
Global Metallurgical & Quality Transformation Leader
Bachelor of Metallurgy | Lean Six Sigma | CBAM Strategy | Industry 4.0 | ESG Performance Architecture

Comments